The Early C.I.C. (Indusco) Movement originally developed in China during the late 1930s. These graphs, made from data collected from regional reports and estimates from annual conferences in Chongqing, help us visualize the scale and scope of the C.I.C. movement over the decade that followed.


The above two graphs depict the rise of Indusco cooperatives following their inception in 1938. We can observe a steady rise in both co-opted factories, as well as members working within them, which peaks at just under 30,000 workers operating nearly 1,900 co-opted factories across China. Following the Summer of 1941, we see a sharp decline in members working for C.I.C. factories and a decline in cooperative factories as well.

The third graph shows the monthly production value for all C.I.C.s from December 1938 to February 1945. This graph attempts to adjust for the unprecedented inflation China faced during WWII, which means all values are pegged to the 1937 value of China’s currency. This graph mirrors the story in the two graphs above, which detail a rise to late 1941, followed by a decline.
This is largely due to increased suspicion by the Nationalist Government that the C.I.C. movement held communist sentiment. This led to threats, arrests, and even some executions of C.I.C. workers and officials, often without evidence or formal charges levied against them. This, of course, led many more officials and workers to consider resigning, while the rest remained under increased police supervision. Adding to that were the incredible amounts of inflation, which diminished the value of loans and donations the C.I.C. received.

This table breaks down our total co-op number from June 1942 by industry and the seven regions within which they operated at the time. We can see that the most productive regions were located largely in the west, with the exception of the Southeast region, which was made up of the Kiangsi, Kwangtung, and Fukien provinces. This chart also allows us to see the specialization of some regions, such as the southeast, which held half of all chemical cooperative factories, or the northwest region, which had roughly two-thirds of all mining facilities.

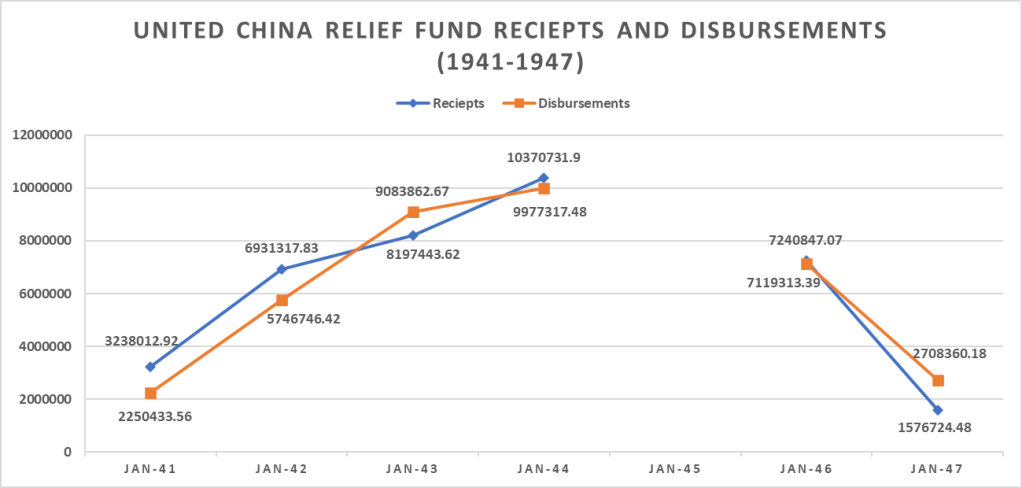
*Some numbers are estimated due to the instability of the exchange rate during this time.
This Graph shows who and from where Indusco was funded. The largest percentage, over 23 million, from banks and private loans, were loans from Chinese banks, largely the Bank of China, which gave 18 million. The second largest, government appropriations, gave just over 11 million. Making up around 3% are funds from individuals, committees, and groups from places like China, the Philippines, Hawaii, Burma, Java, India, Siam, Singapore, Australia, New Zealand, England, and the US. At around 2% are “Special Funds”, from notable places such as 50 thousand from Madame Chiang Kai-shek and 6 thousand from Soong Ailing, wife of H.H. Kung, as well as 150 thousand from the American Advisory Committee for Civilian Relief in China, headed by Eleanor Roosevelt. Lastly, there is the paid-up share capital from members, which totals just under 400 thousand.
*No data available for 1945.
The United China Relief Fund was a cooperative association that provided aid to China and its people, beginning during the Second World War in 1941 and continuing until 1949. The above graph shows the receipts, or money donated, to the United China Relief Fund and disbursements, or money used by the fund. These disbursements were used for all types of aid to Chinese citizens, such as medical and public health projects, child welfare, education, reconstruction, disaster relief, and rehabilitation.
